HRV Measurement and Parameter
How is the HRV being measured, and what parameter makes which statement possible?
The analysis of HRV is done by different approaches. The main types are time domain analysis, frequency domain analysis and non- linear analysis.
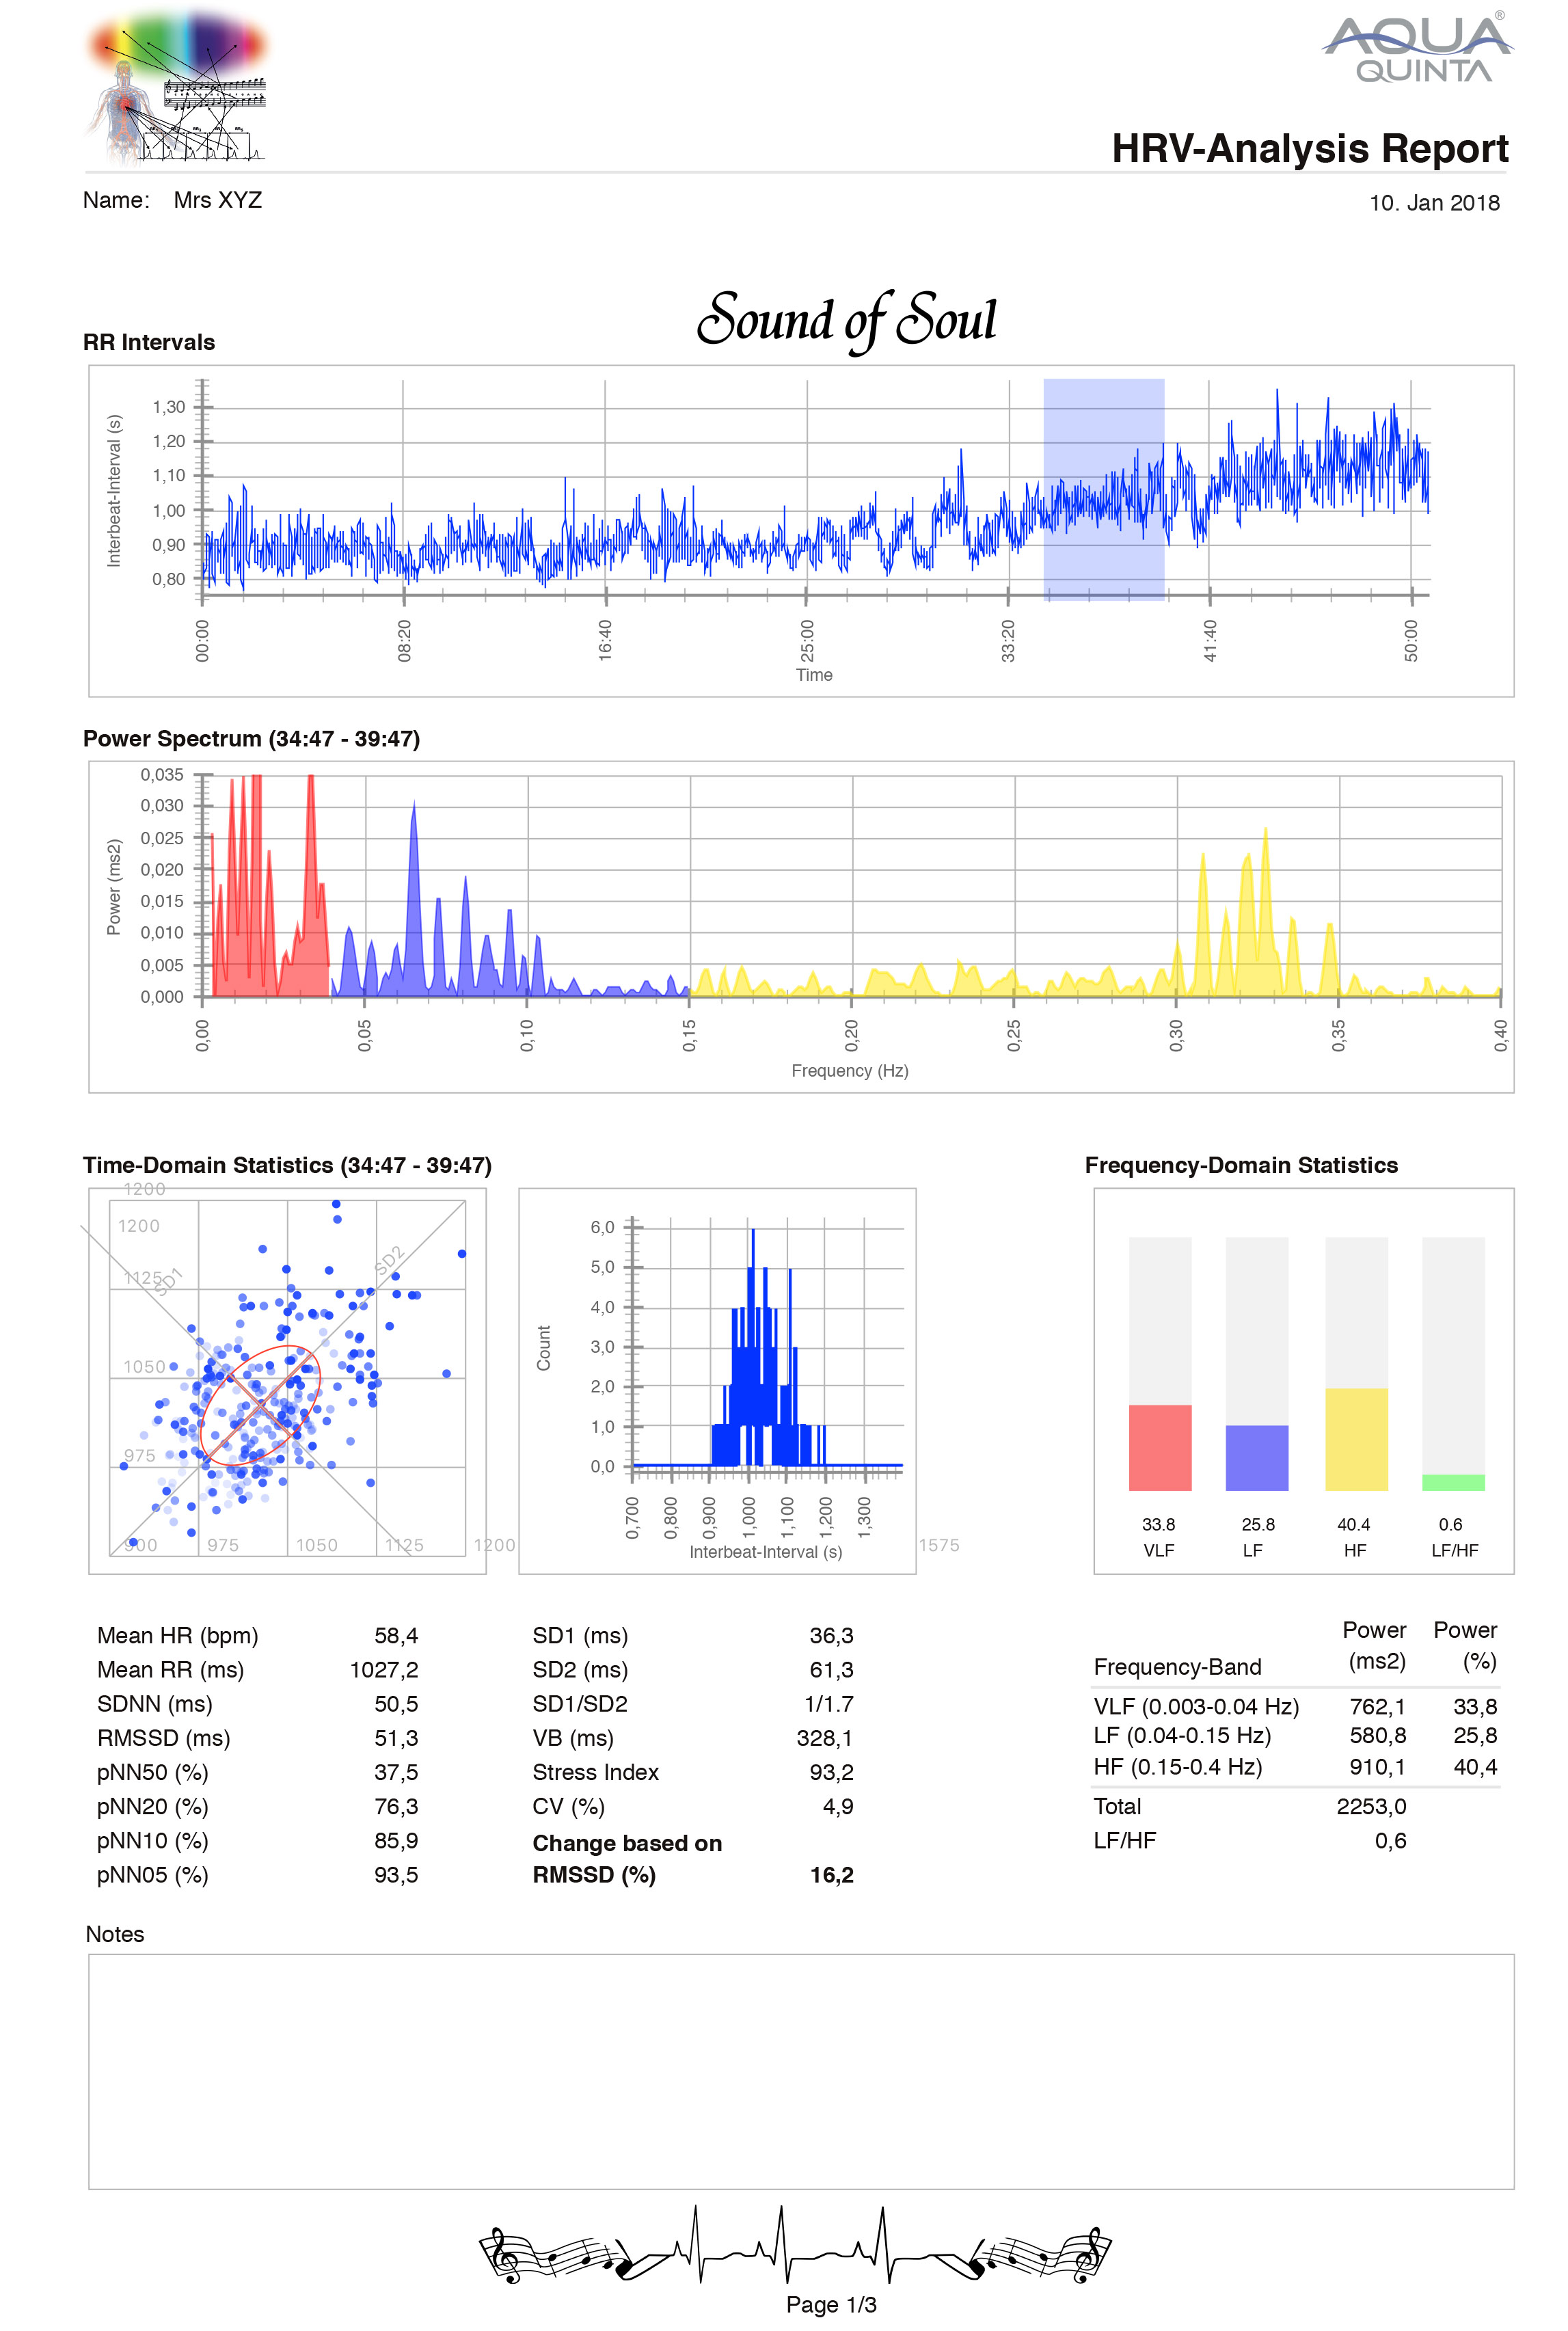
With the Sound of Soul HRV-Editor software you can edit, summarise and evaluate the automatically recorded HRV Data.
In the analysis of HRV the common methods applied are either the 5 minutes HRV or, during long term measurement, the 24 hours HRV.
Because of different statistics, values can differ significantly depending on the duration of the measurement. It is therefor important to always compare the same HRV recording times.
In general, it can be stated that the longer a HRV measurement the higher most HRV parameters will get.
Time domain analysis
In the time domain analysis the recorded RR – intervals (Interbeat – Intervals) are statistically evaluated. During the years different statistical parameter (calculation models) have been established, trying to describe the HRV best possible.

Mean HR (bpm – beats per minute) – pulse
… average number of heart beats per minute
In relaxed state it should neither be too high (Tachycardia) nor too low (Bradycardia).
Young people have normally a faster pulse. Regular sport activities, especial endurance sports, lead to a lower resting pulse (below 60 bpm). Values between 60-75 are for most people, who have a healthy life style the norm. A constantly high pulse is typically for less sporty, often obese and stressed people. Normally the heart rate decreases during age.
Mean RR (ms) … average distance in milliseconds between RR-Intervals
The mean RR is in direct relation to the pulse (formula: 60’000/pulse). The faster the pulse, the shorter the RR-Intervals. A pulse of 60 bpm corresponds to a RR-Interval of 1000ms, a pulse of 75 bpm corresponds to a 800ms etc…
SDNN (ms) … indicates standard deviation of normal to normal R-R intervals
Reflects the activity of the ANS and its regulating function. Should be during a 5 minutes HRV measurement > 50 ms.
If continuously measurements show values below 20 (during a longer time period) a risk of chronic diseases, based on a bad regulating nervous system can be the consequence.
The SDNN values are strongly dependent on the recording length. The values mentioned here refer to 5 minutes HRV measurement. During a 24h HRV recording SDNN values are much (about 3x) higher.
The HRV and especially the SDNN values reflects very nicely the lifestyle, which is typical for a society. Sat Byul Park et al. shows in a study conducted in South Korea that the average SDNN values of the adult population is 36ms. However, the average SDNN value in the Chinese population is almost twice as high (compared study of Acharja R. et al.). Of course it is very much dependent on where you conduct such research. Nevertheless it can clearly be stated, that in our so called modern society, which stresses from one moment to the next, a reduced HRV becomes a characteristic feature.
RMSSD (ms) … root mean square of successive heartbeat interval differences.
It describes the change of heart frequencies from one heart beat to the next. It is comparable to the SDNN, whereas it is better suited for short time measurements. The RMSSD value is more susceptible for the influence of artifacts. The RMSSD reflects as the pNN50 the parasympathetic activity.
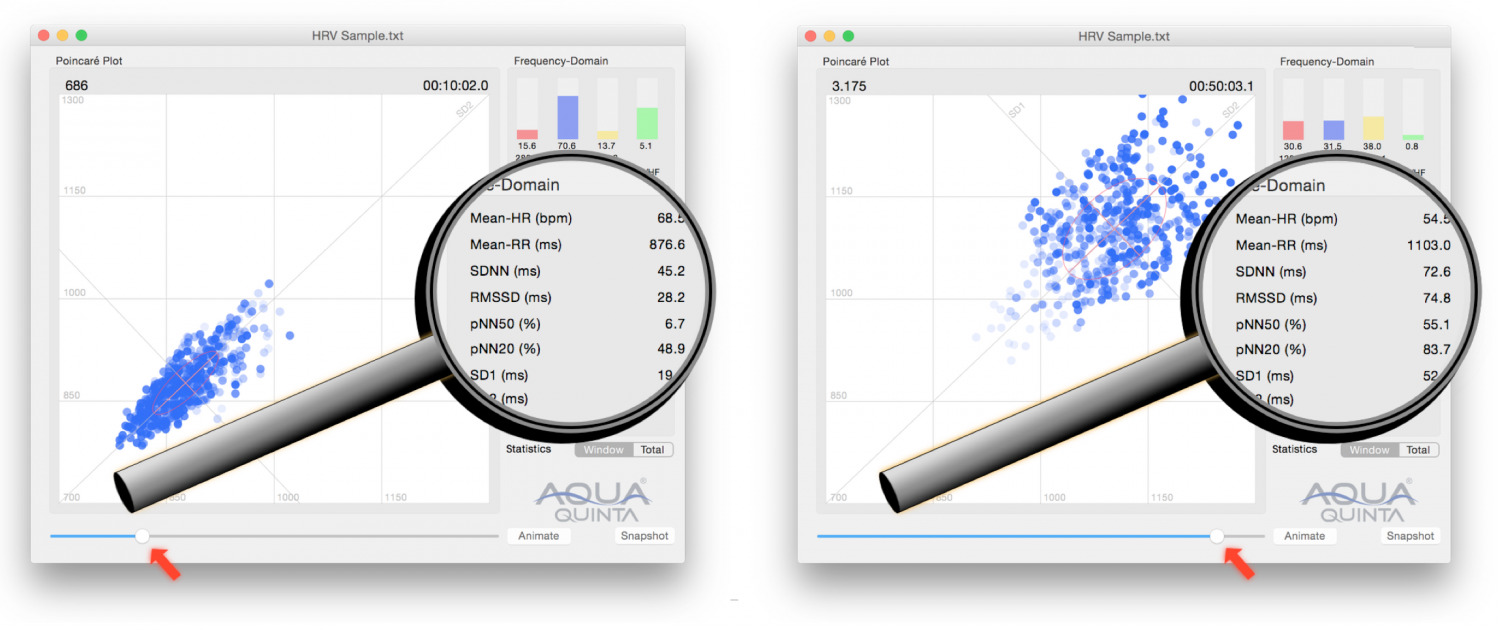
If the RMSSD value increases during a Sound of Soul recording, and becomes as high or even higher than the SDNN value, it is a good indicator for a successful treatment.
It is easily to observe, if you move the cursor in an opened HRV recording in the Sound of Soul program (see following graphics – after 10 minutes/after 50 minutes).
pNN50 / pNN20 (%) … percentage of successive RR intervals >50 / 20ms
Regarded as an indicator for parasympathetic activity. Decreasing values during several measurements correspond to a prognosis of unhealthy changes.
Generally it can roughly be said, that the pNN50 should be > 20% and the pNN20 should be > 50%.
Usually if a person is very exhausted, or recently had a hard time, the pNN50 values become low, sometimes even tending to 0%. If the measured pNN20 value remain at the same time still quite high (>20%) it is a good indicator, that the person has a good ability to recover easily. Which means that with not too much effort the HRV values can generally become better.
If the pNN20 value is approaching 0% a medical check-up and a consideration of a drastically change in one’s lifestyle is recommended.
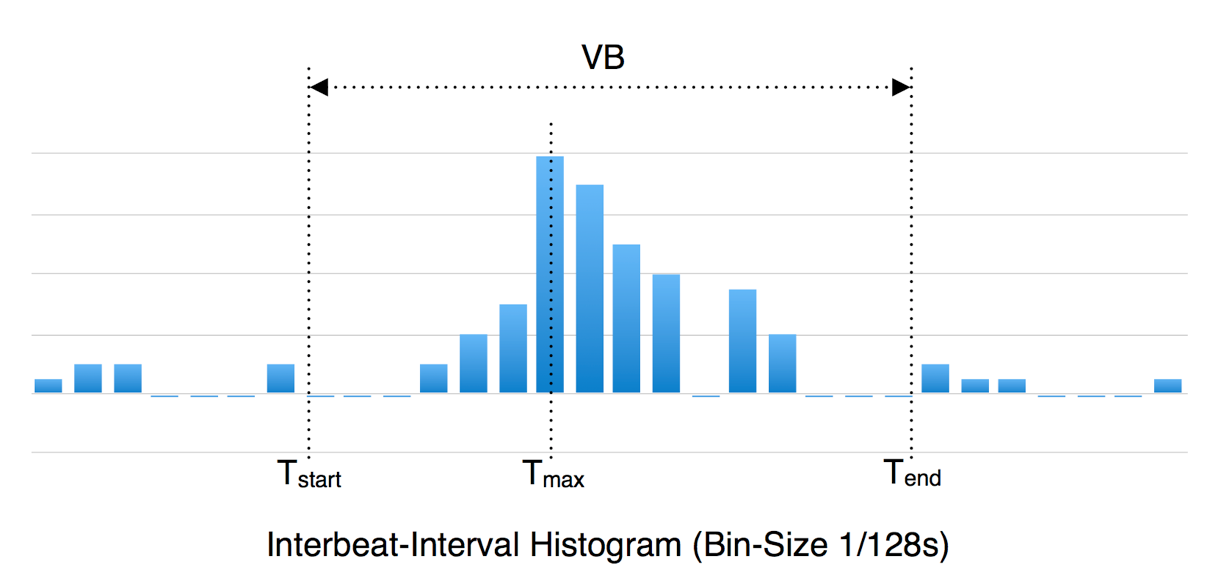
Histogram
It is a graphical display where the frequency of data of the different RR- Intervals is grouped into ranges and then plotted as bins.
(Bin – width in the histogram is according to the recommendation of the HRV-Taskforce 1/128 second).

The bigger the width of the histogram the better.
A strongly reduced HRV looks like a needle in the histogram.
During long time measurements the histogram shows normally several peaks.
VB… (Variation Broadness)
The variation broadness describes the width of the core – area of the Interbeat – Interval in the histogram. Starting from the maximum value of the histogram (Tmax) the first interruption in the beginning (Tstart) and at the end (Tend) area determined, which takes at least 3 histogram bins.
VB = Tend – Tstart.
(The VB is similar to the TINN value, which is used in many HRV analysis programs. Even though the TINN value has been defined by the European Task Force does this value (based on different calculation models) vary strongly between the different HRV analysis programs. Therefore has Aquaquinta in cooperation with the FH Dornbirn/Austria established an alternative VB value).
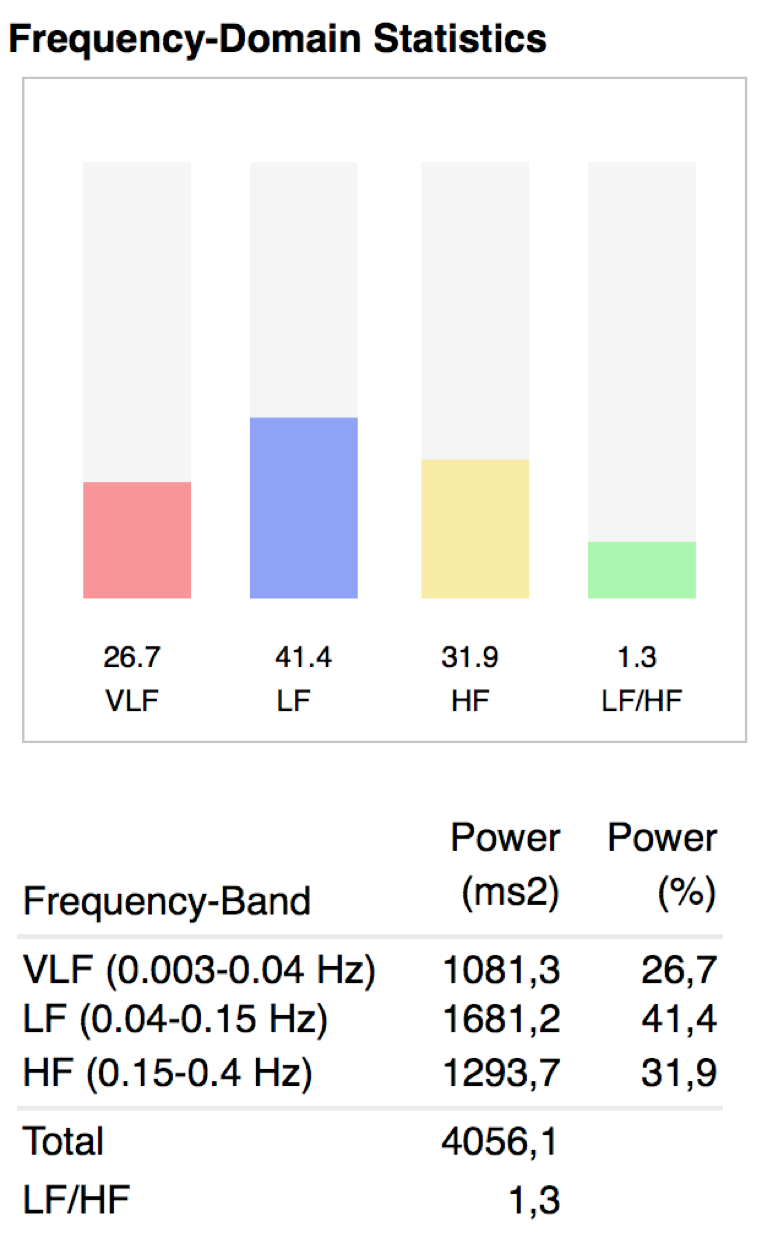
Frequency domain analysis
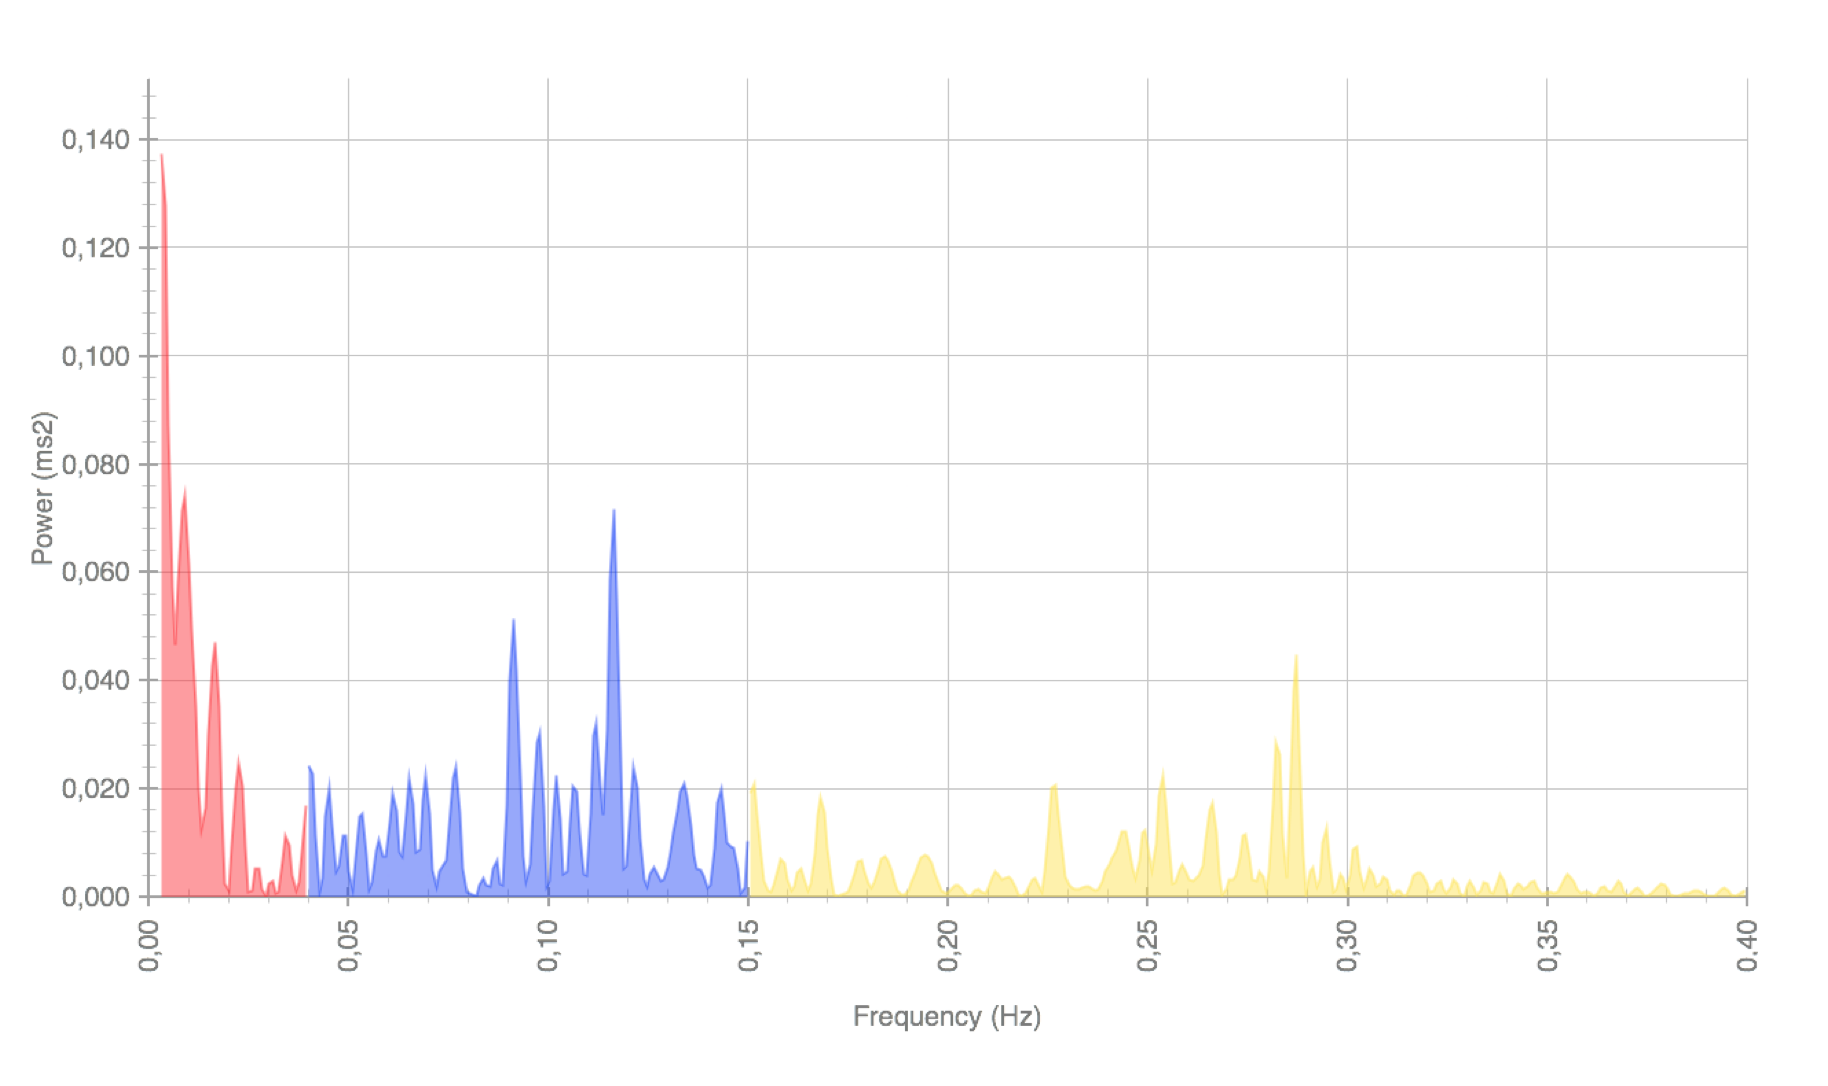
In the frequency domain analysis, the frequency signal of the heart is divided in different frequency bandwidths. Studies show, that activities and regulation processes of the body are reflected in certain frequency areas, as for example the thermoregulation, inflammatory processes, respiration, baroreflex etc. The frequency bandwidths are divided into Very Low Frequency (VLF), Low Frequency (LF) and High Frequency (HF). In some HRV studies there is a further distinction made for a Ultra Low Frequency (ULF), which is not considered here, because it is not very relevant in short time HRV measurements.
The colors used for the different frequency bandwidths vary between HRV analysis programs. The colors here are related to the Kubios program from the University of Eastern Finnland (see www.http://kubios.uef.fi/KubiosHRV/), which is commonly used by many universities.
VLF (0.003-0.04 Hz) … (Very Low Frequency)
Mainly dominated by the sympathetic nervous system.
Evaluation of VLF values have to be done very carefully in a short time HRV measurement. A frequency of 0.04 Hz (Hz = vibration per second) implies, that during a 5 minute measurement only 12 vibration-rhythms are recorded (= 0.4 x 60 x 5). In other words, there is very little data available to guarantee a certain statistical accuracy. If in comparison with several short time HRV measurements the VLF values show the same tendencies statements can be made.
The VLF values are used to interpret thermoregulating activities, inflammatory processes and hormonal regulation in the body. Such processes are normally slowly in its reaction.
The VLF values reflect slowly mechanism of the sympathetic nervous system.
LF (0.04-0.15 Hz) … (Low Frequency)
Low frequency, reflects both sympathetic and para-sympathetic activity. (Parasympathetic influence especially during a breathing frequency of ≤ 7 per minute).
LF is generally regarded a strong indicator of sympathetic activity.
The LF is the active area of the autonomous nervous system, often referred as the fight and flight mechanism of the body. The frequency around 1Hz reflects the activity and regulation of the blood pressure/baroreflex.
The sympathetic activity leads to a decrease in the HRV.
An unbalanced, stressed lifestyle leads to a continuously dominant sympathetic activity. Short breath is a typical indicator for sympathetic dominance.
Thinking and Stress has a big influence on the sympathetic activity. Also mental projected / imagined stress has an influence on the sympathetic activity (the body does not distinguish between reality and imagination).
HF (0.15-0.4 Hz) … (High Frequency)
Mainly dominated by the parasympathetic nervous system.
The higher the values normally get, the better the HRV. High HF values lead to an increase of the HRV.
Vagal tone … is an internal biological process referring to the activity of the vagus nerve, the tenth cranial nerve located in the medulla oblongata of the brainstem. The vagus nerve serves as the key component of the parasympathetic branch of the autonomic nervous system, regulating the homeostasis (or “resting state”) of the majority of the body’s internal organ systems that operate on a largely subconscious level, such as the heart, lungs, eyes, adrenal glands, and digestive tract.
The HF is strongly influenced by the respiration. During inhalation the vagus activity is reduced, during exhalation it increases again. Through breathing exercise and techniques the HRV can literally be trained.
Relaxation exercises; “Turn of the mind” leads to a deep relaxed breathing, decrease in body and emotional tension and to a decrease in sympathetic activity as to a better HRV.
Attention leads to deep relaxation and balance in the autonomous nervous system..
The parasympathetic influence leads to an increase of the HRV.
LF/HF … Relationship between LF to HF
Reflects the ratio between the power of Low Frequency and High Frequency bandwidths. This measure indicates overall balance between sympathetic and parasympathetic systems (it is only partly correct, because the LF can, as mentioned above, also contain parasympathetic influences)
LF/HF ↑ = higher values reflect domination of the sympathetic system
LF/HF↓=lower values reflect domination of the parasympathetic system
In relaxed and balanced state the LF/HF ratio should be 1.5 or less.
Total (Frequency Power)/ T(FP) (ms^2) …
(often referred to as total energy)
An estimate of power spectral density in the range of frequencies between 0 and 0.4 Hz. (Here the ultra low frequency from 0-0.003 is not put in consideration)
This measure reflects overall autonomic activity of the HRV.
 Low total power can be put in relation to low SDNN value of the time domain analysis. The total power values are strongly dependent on the recording length. During 24h HRV measurement these values are up to 10x higher compared to a 5 minutes HRV recording.
The sympathetic influence is normally the dominant part of the measured frequency.
The total power value should during a 5 minute HRV analysis be 2000ms2 or more. Nevertheless the measured value is less for many people. In case of exhaustion, sleeping/resting shortage, after heavy and big meals, the total energy value decreases.
A balanced, sporty, healthy adult show in relaxed state (often) values far higher than 3000ms2 during a five minutes measurement.
People, who do active sport on a regular basis like swimming, running etc. implement good stretching (this seems to be as important for the body as motion; like Yoga, Pilates, Tai Chi etc), who include enough relaxation periods, show results the same as most healthy active children, during a 5 minutes HRV measurement of 10’000ms2 or more in total energy.
People whose life is very stressed and unhealthy often show total energy values of few 100ms2 even in a relaxed state. The heart has literally over years been trained into a rigid state.
According to a study of S.B. Park et al. show healthy ~ 45 year old people of South Korea (one of the most stressed societies world wide) a total power of 1100ms2.
Power (%) … reflects the %-level of each frequency bandwidths of the autonomic nervous
(The ULF (0-0.003 Hz) is not put in consideration in the data represented here)
Non Linear Analysis
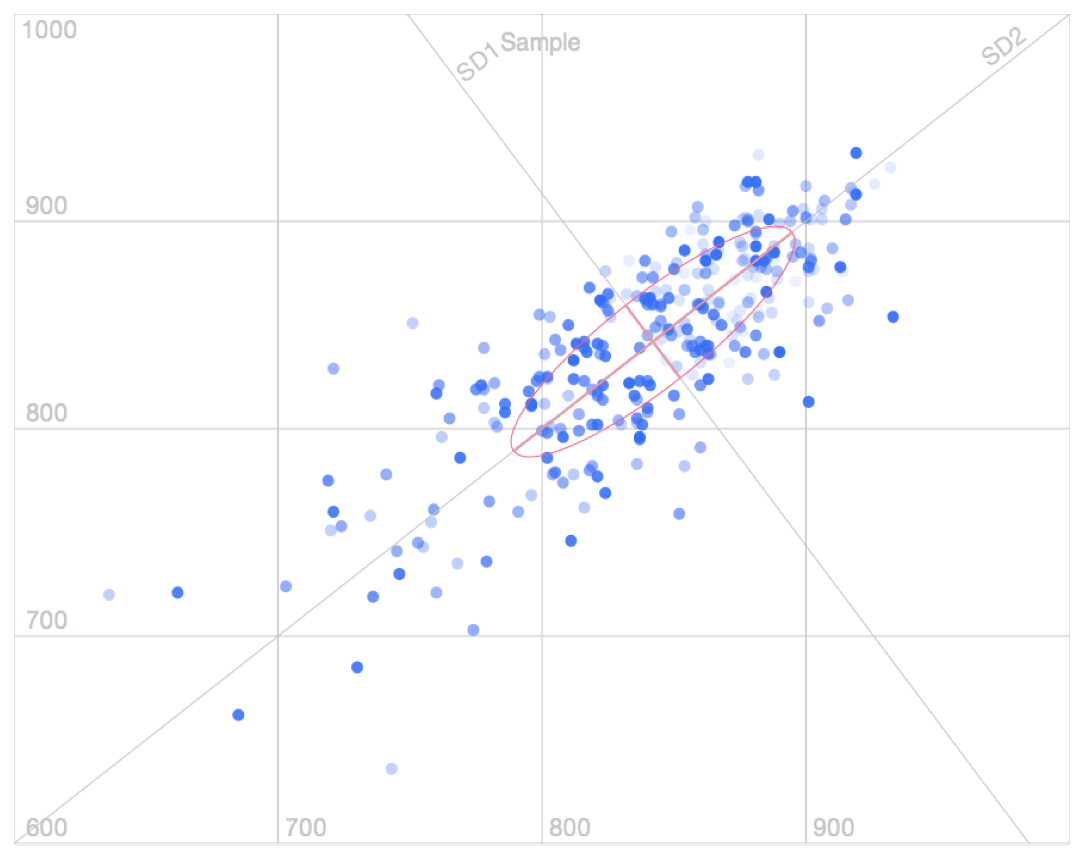
Poincaré Plot ( Scatter Plot)
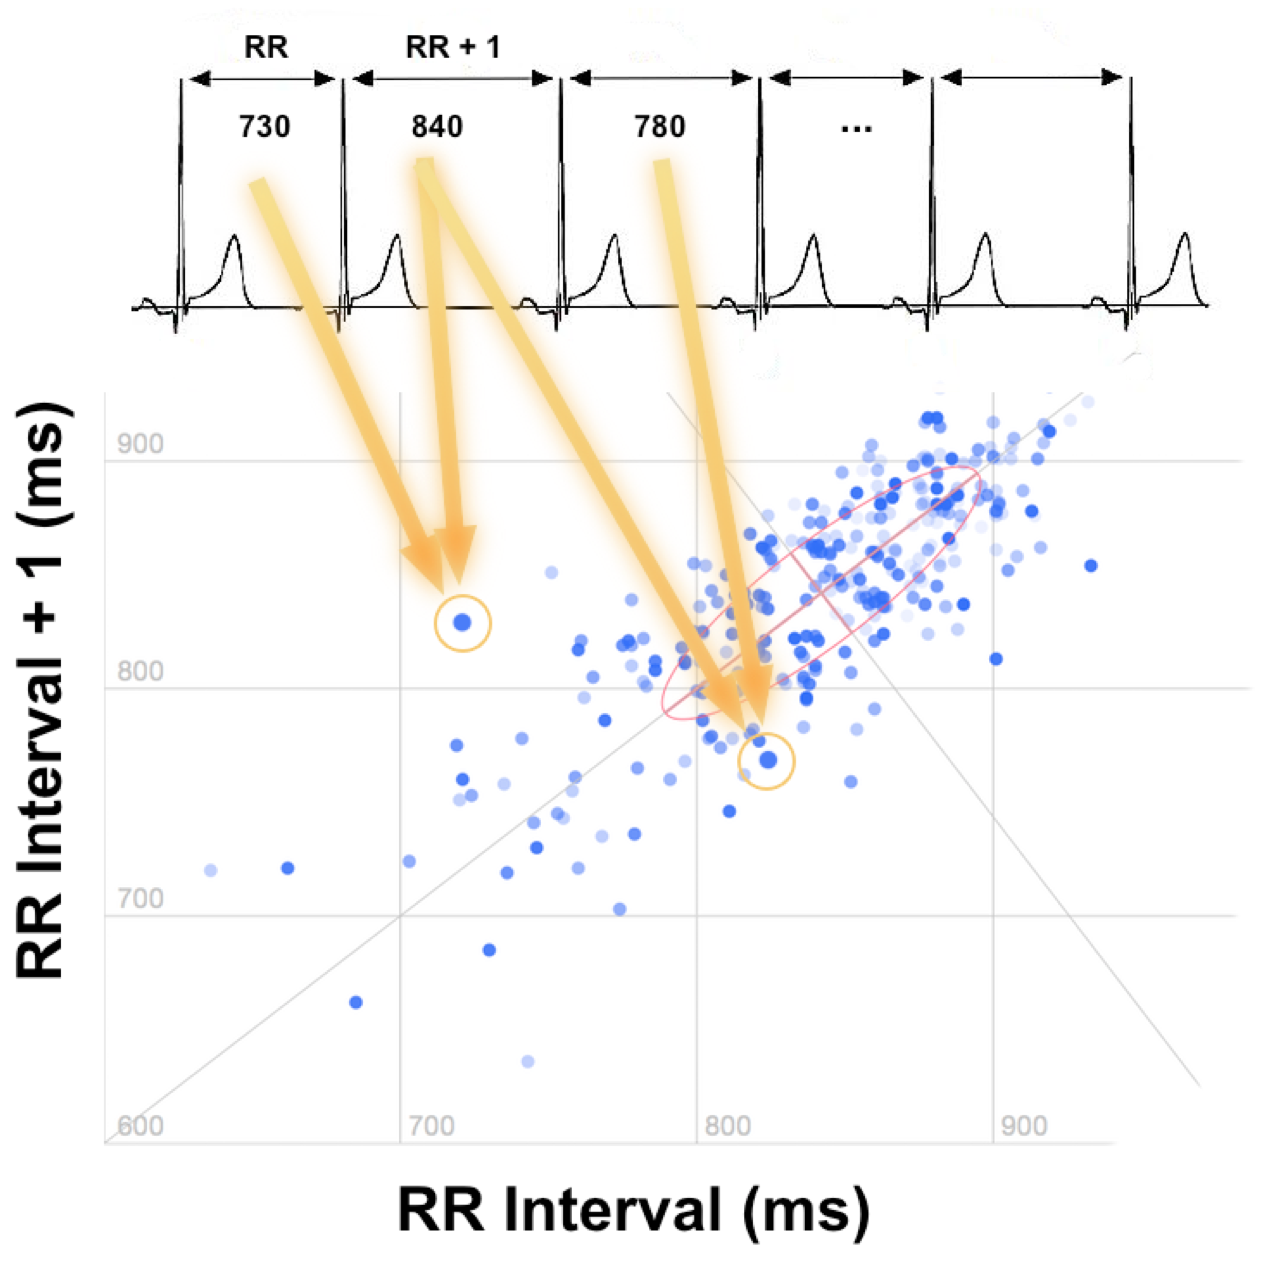
(named after Henri Poincaré, 1854-1912)… is the graphical illustration of the relationship of a RR-Interval to the next RR-Interval (RR+1).
With other words, the first point plotted on the graph reflects the relationship from the first RR distance (measured on the X axis) to the second RR distance (measured on the Y axis). The next point is the relation from the second RR distance (measured now on the X-axis) to the third RR distance (measured on the Y-axis), and so on…
The bigger the variance of the consecutive RR distances, the more open the “point cloud” / Poincaré Plot gets.
SD1 (ms) … standard deviation of the orthogonal distances of the RRi/RRi+1 –points to the across diameter of the ellipse (breadth of the point cloud in the Poincaré Plot– shows especially the change in the higher frequency areas). SD1 is considered to describe the short-term heart rate variability.
The SD1 value is also related to the “new vagus” according to the Polyvagal Theory of Stephen Porges. (The Polyvagal Theory describes the development of social behavior in relation with the development of the autonomous nervous system).
A hight SD1 value is also an indicator for a rapid adjustment ability of the body to stress situations.
The SD1 value reflects as the pNN50 and the RMSSD value the parasympathetic activity of the autonomous nervous system.
SD2 (ms) … standard deviation of the orthogonal distances of the RRi/RRi+1 to the length diameter of the ellipse. SD2 is considered to describe the long-term heart rate variability.
SD1/SD2…
Ratio between SD1 to SD2
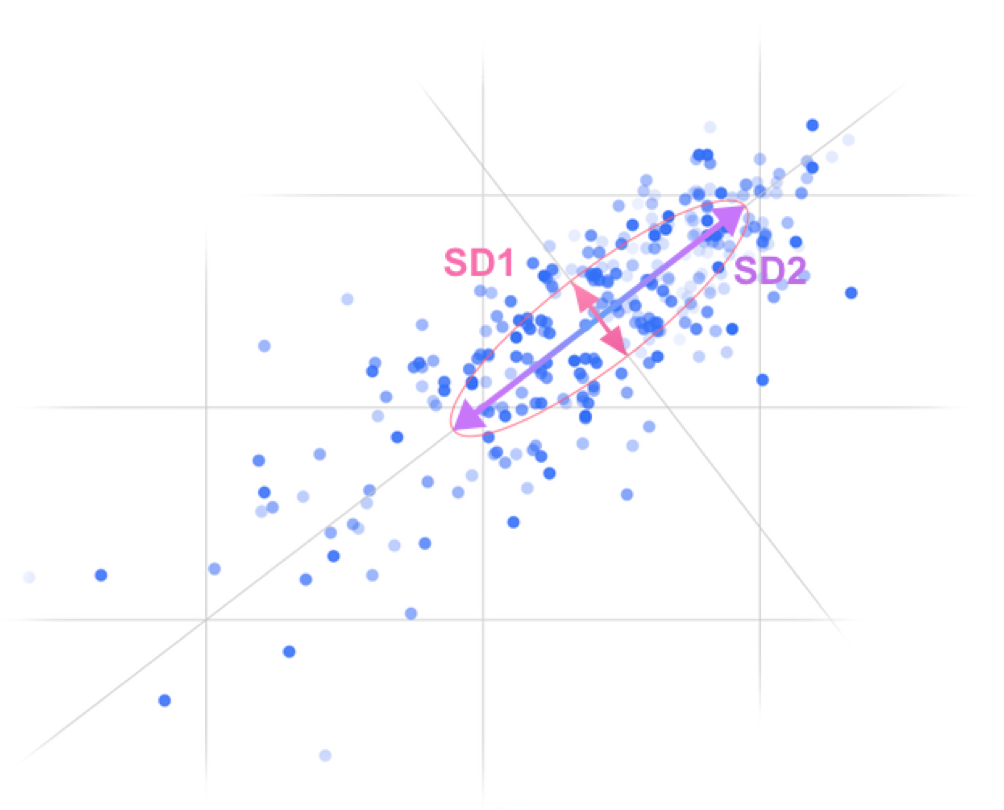
A balanced autonomous nervous system is reflected by a SD1 to SD2 ratio of 1/2 to 1/3. The form of the point cloud looks like the shape of an egg.
If the SD1 is very low in relation to SD2 (ratio 1/>3), the point cloud becomes flat, it is a sign of exhaustion.
If the SD1/SD2 ration is 1/<2, the point cloud becomes the shape of a circle. It might be a sign of an emotional blockage (this has to be verified by further studies and data). Respiratory sinus arrhythmia (RSA) is a naturally occurring variation in heart rate that occurs during a breathing cycle. Heart rate increases during inspiration and decreases during expiration [/av_textblock]
This post is also available in: